

London’s first segregated cycle track was introduced in London in 1934 by Leslie Hore-Belisha, a precursor Minister of Transport (he also introduced pedestrian crossings and 30 mph speed limit). Some have claimed that since that remarkable start, not much has been accomplished, and that London lags behind its European counterparts.
In this article, we will compare London with other major European cities known for their bike-friendly policies or substantial efforts. We will provide examples of good infrastructures that could be implemented and discuss the responsibilities of different stakeholders: the central government, the Mayor of London, and local boroughs.
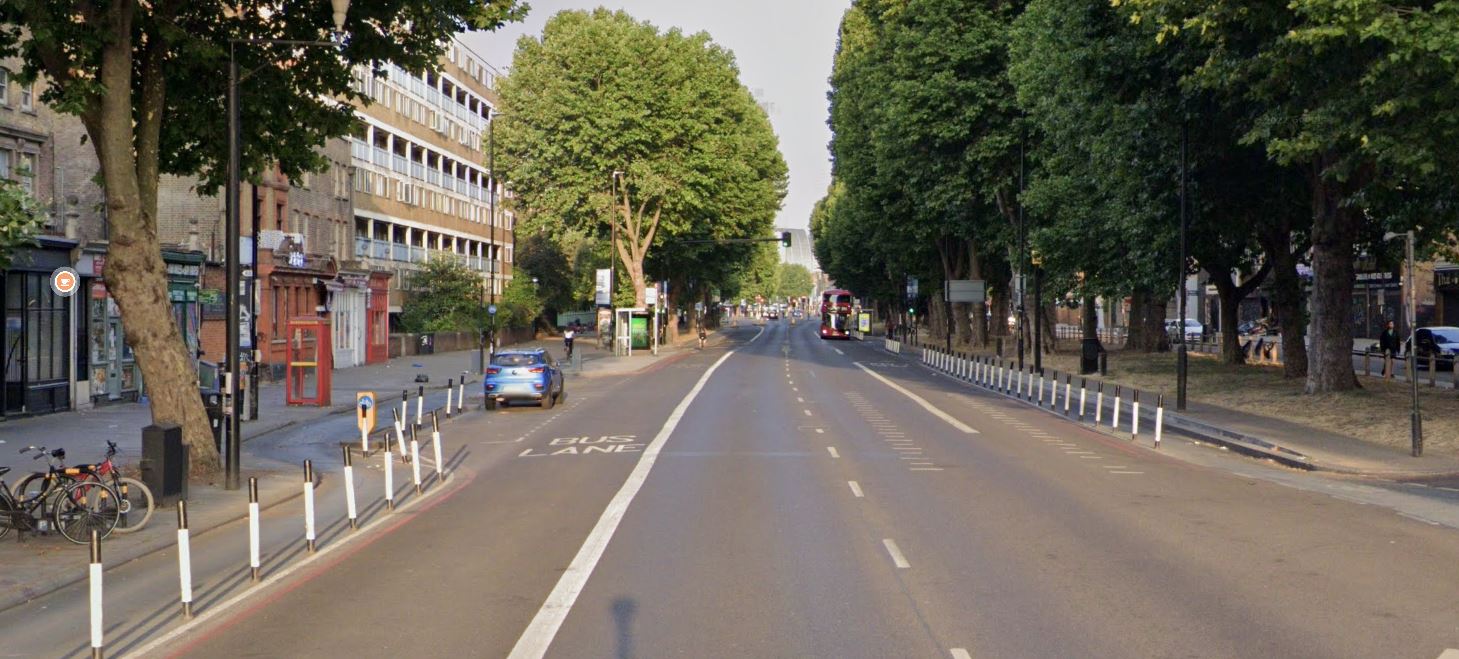
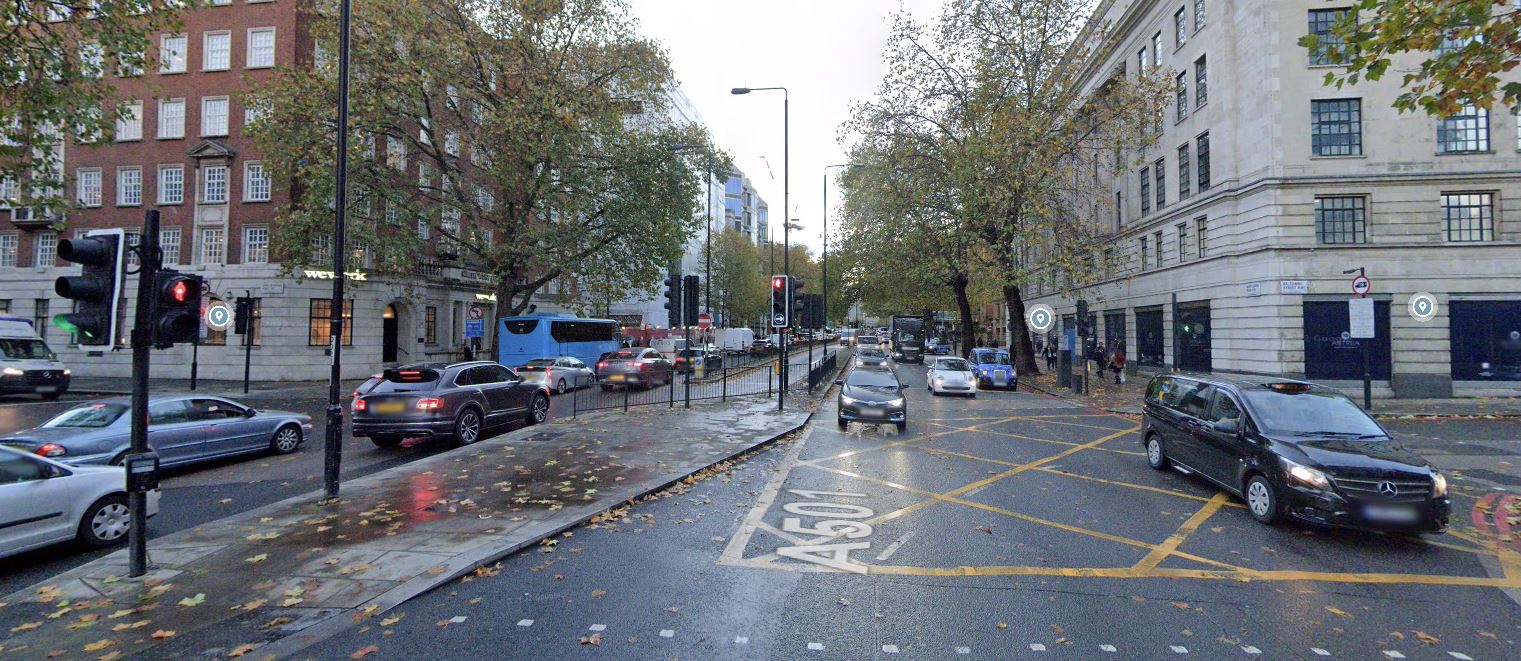
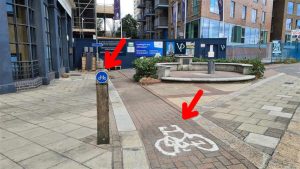
When cycling infrastructures are not much more than a bit of paint on the road
While an innovative minister opened the first cycle lane in London in the 1930s, it remained largely an isolated effort until the 1980s when the idea of creating links between London Borough town centres resurfaced. It was called the London Cycle Network and was supported by London Cycling Campaign and Ken Livingstone (as Leader of the Greater London Council from 1981-86). However, it did not meet much success, mainly due to the lack of funding (most of the work consisted of signposting and, in some places, painting white lines on roads) and the inappropriate design of the cycle routes (most of the links were recommended routes on backstreets).
The idea was revived when Ken Livingstone returned as the new mayor of London from 2000 to 2008. He announced 12 Cycle Superhighways in 2008. CS12 and CS10 were later dropped from the programme but CS6 (North- South) was added, making the total number of routes 11.
Boris Johnson was fortunate when he became Mayor of London in 2010, as he was able to highjack the work and launch the bike-sharing system himself (then sponsored by Barclays, now Santander). He also oversaw the implementation of Cycle Superhighways, which were designed under his predecessor.
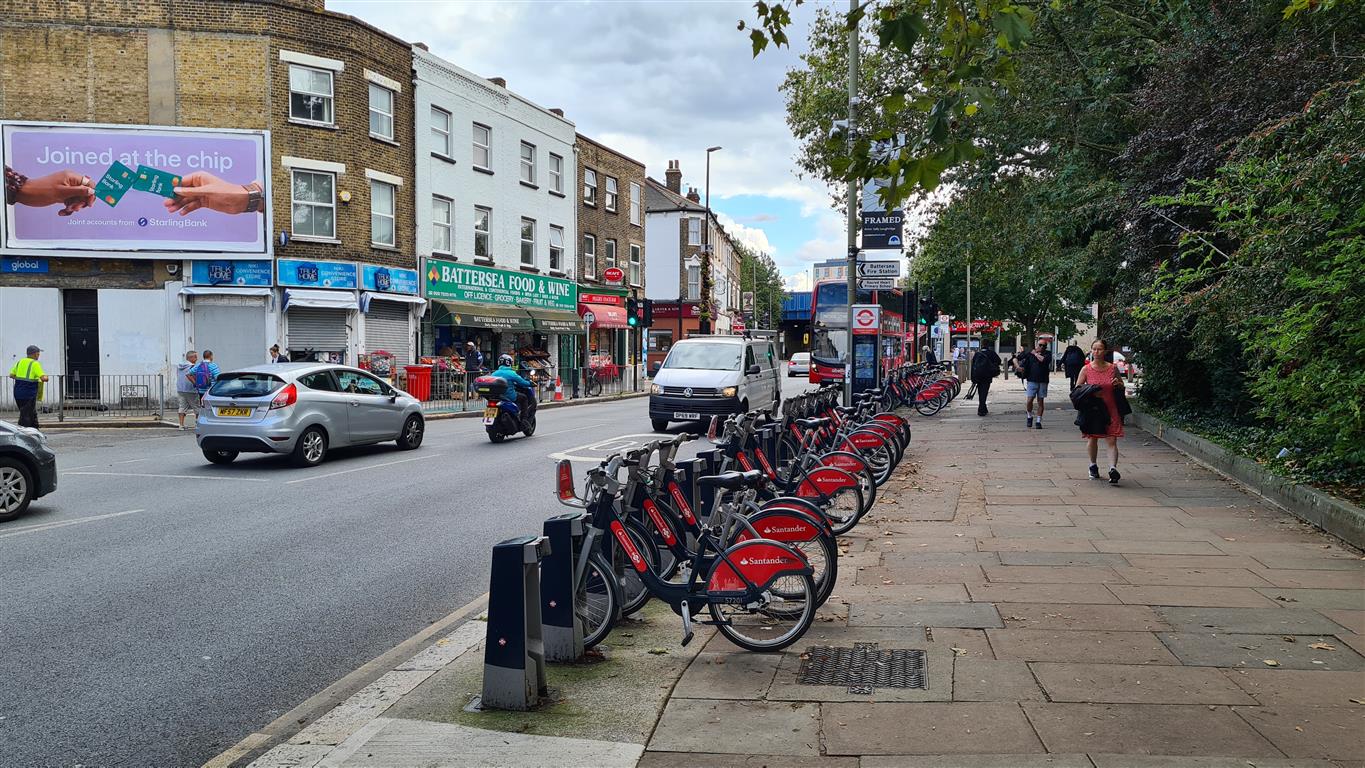
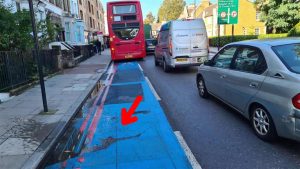
London opened its first cycle superhighways in 2010 (labelled CS3, CS7) and 2011 (CS2, CS8 – which can be found on York Road and Battersea Park Road for instance). The plan was to improve the visibility of existing signage (painting the cycle lane blue) at a (very) low cost.
They were advertised as build to high standards, containing segregated cycle tracks and junctions restyled to separate cyclists from motorists, matching international best practices to provide safe and comfortable conditions for cyclists. However, from the beginning they were criticized as being in reality cheap paint-only cycle lanes (since the London Cycle Network in the 1980’s, it looks like making London a cycling-friendly city is often associated with paint for politicians).
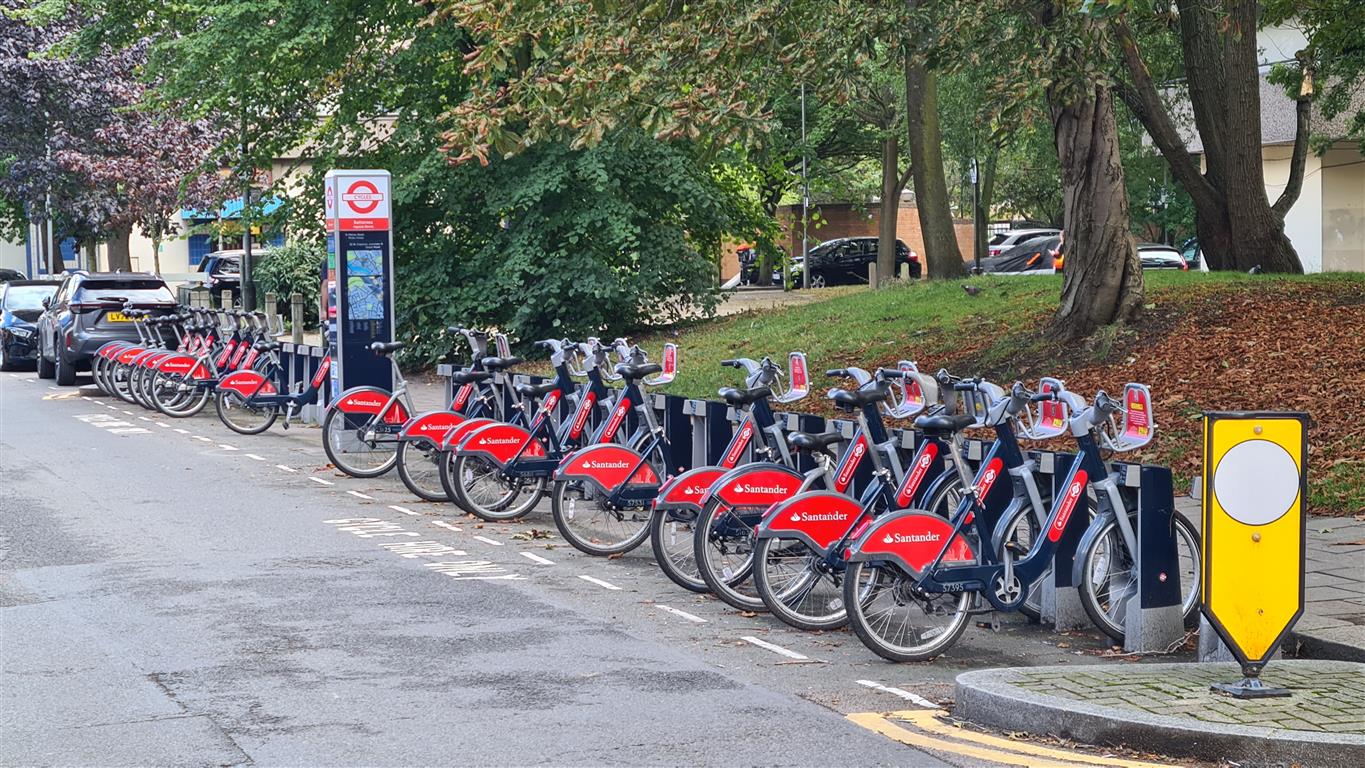
The cycle rental program began with 5,000 bicycles and 315 docking stations, covering the City of London and eight London boroughs. In subsequent years, it expanded, adding 2,000 bikes and 150 docking stations in inner boroughs (Wandsworth, Hammersmith & Fulham, Lambeth, and Kensington & Chelsea). In 2015, sponsorship for the program shifted from Barclays to Santander.
In more recent years, other private operators have deployed dockless bikes that can be picked up and left anywhere (at least when there is no zone restriction). There are currently four operators in London offering the service: HumanForest, Tier, Lime, and Dott (the last three also operate e-scooter schemes).
With Boris Johnson’s image as a keen cyclist, this gave the impression that London was on the path to becoming one of the most cyclable cities.
London still lags behind major European cities
Boris Johnson promised “a proper network of cycling routes throughout the city” and pictured cycling becoming “an integral part of the transport network.” When Sadiq Khan succeeded Johnson as Mayor in 2016, his campaign manifesto stated: “My aim is to make London a byword for cycling around the world.” Campaigning for re-election five years later, his 2021 manifesto pledged “a revolution in walking and cycling,” claiming that “London’s efforts to encourage more cycling are world-leading.” He also stated that he had gone “far beyond [his] promise of tripling the amount of segregated cycle lanes” and that he would “continue the rapid expansion of London’s cycle network—connecting communities and town centres with protected cycleways on main roads and low-traffic routes on local streets.”
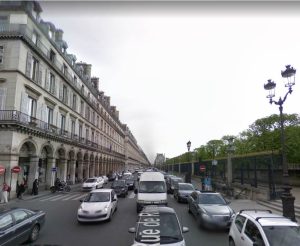
Currently, some claim that London hold the title of being Europe’s largest cycle rental initiative, boasting 11,000 bicycles and 800 docking stations spread across a 40-mile radius. A simple comparison with Paris debunks this call: Vélib provides 1 464 docking stations in Paris and its region with 19,000 bicycles (40% of which are electrics).
- Read our article: Making London a cycling-friendly city: Is there enough ambition?
In any case, the number of rental bikes on offer does not make a city cycle-friendly, otherwise Copenhagen and Amsterdam (where you have more private bikes owned than inhabitants) would be trailing behind.
There seems to be a substantial gap between the promises of politicians and the reality of London’s cycling network.
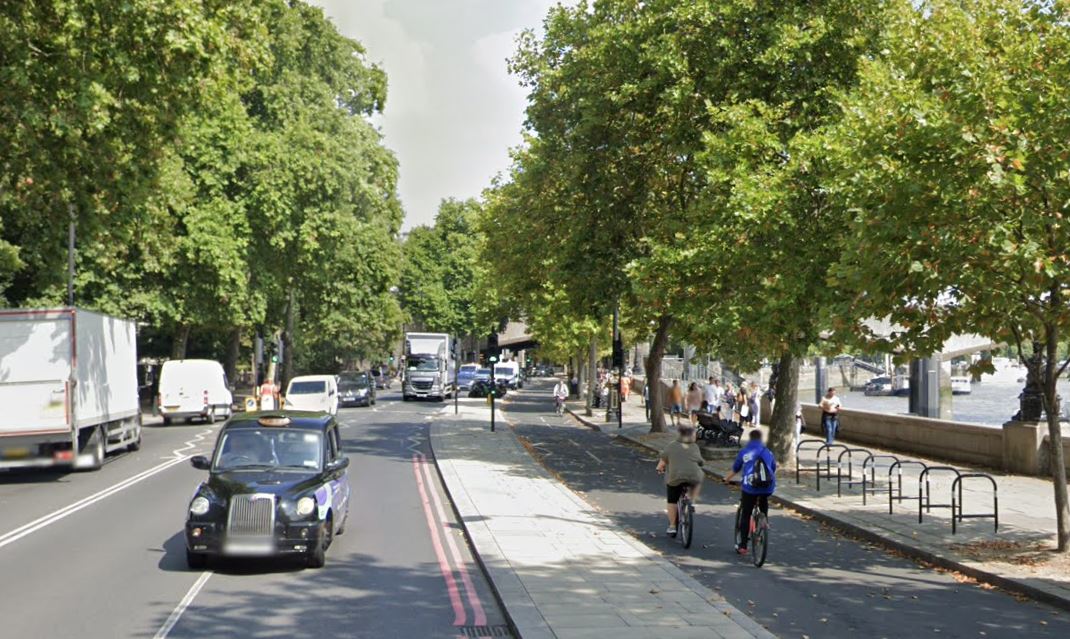
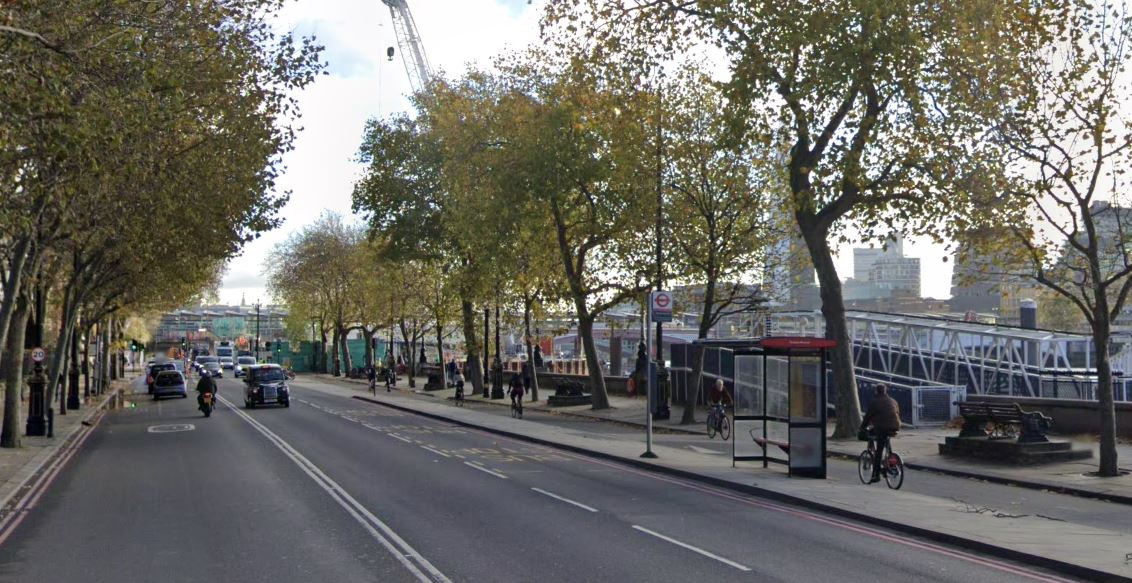
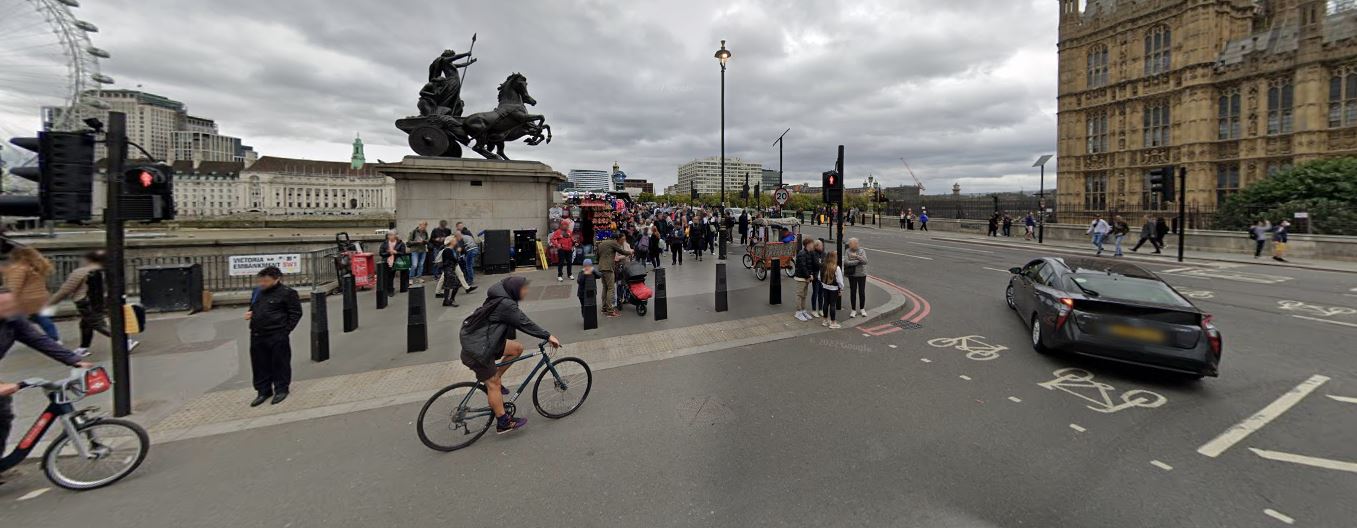
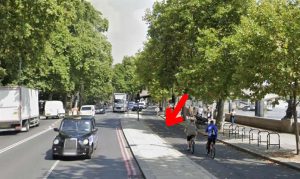
Indeed, some efforts have been made, and the cycle path along the Embankment (from Westminster Bridge to Tower Hill and further to Limehouse) is often cited as an example.
There is also a good example from Aldgate to Stratford.
However, while London has developed an exemplary segregated cycle lane at its centre, this seems like a limited effort to develop infrastructure to protect cycling in the capital.
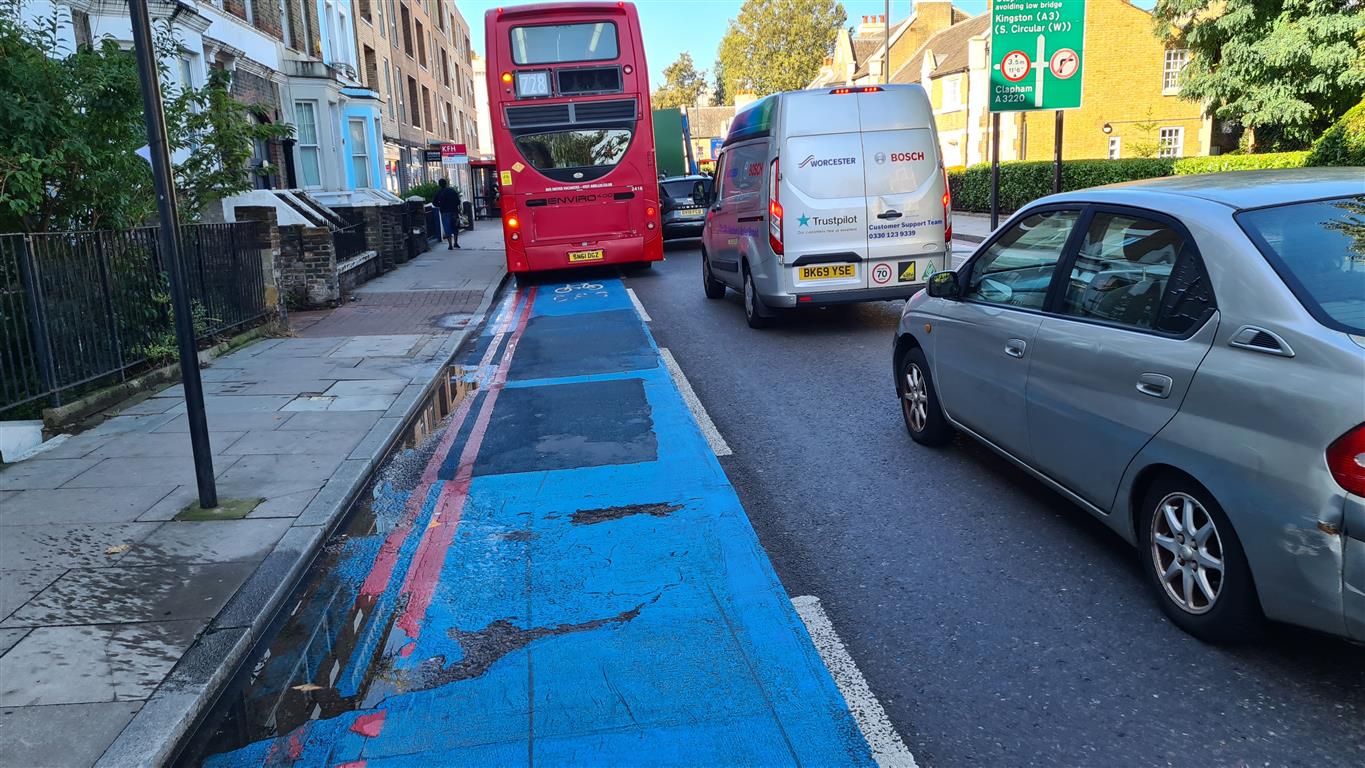
Not only are their cycle superhighways narrow and unsafe, but they have also not been maintained and are often reduced to a few patches of blue paint, such as along Battersea Park Road in the Clapham Junction area.
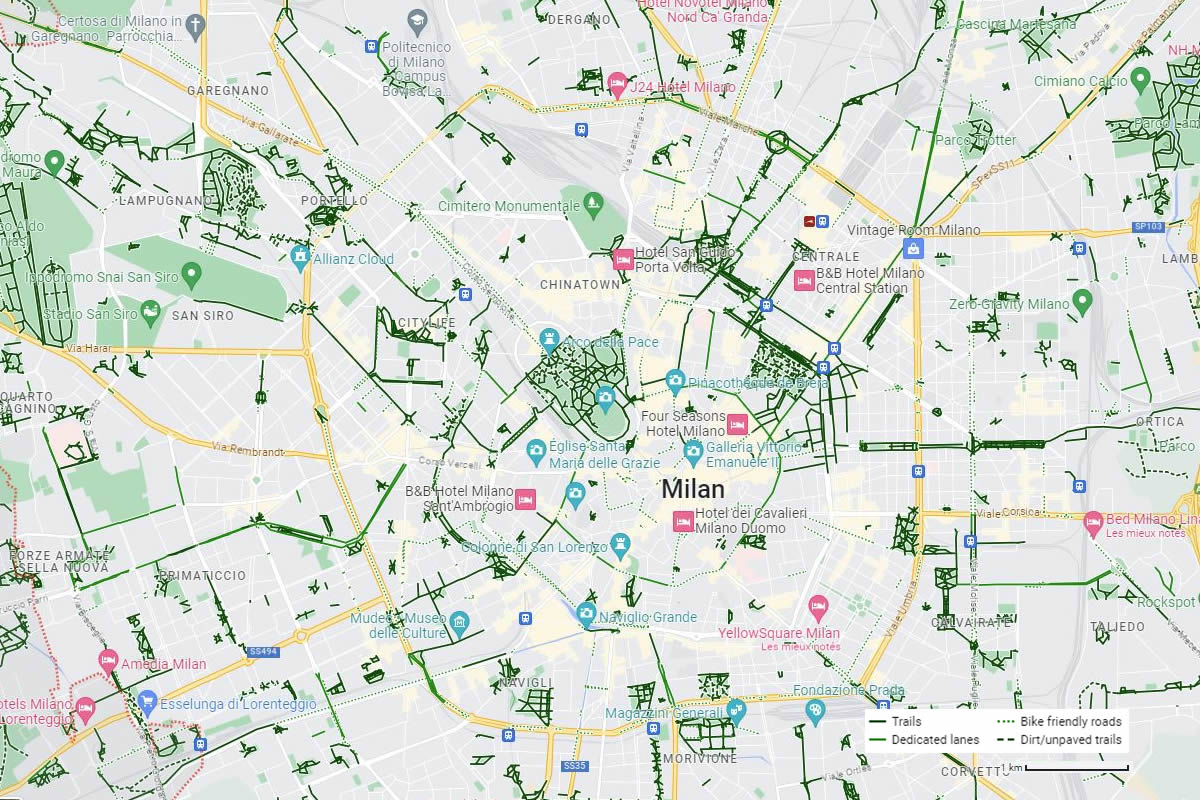
Google Maps is a valuable tool for comparing the cycling networks of different cities. In the following maps, we have used the exact same scale to show the cycling network in six different cities: London, Paris, Berlin, Amsterdam, Copenhagen, and Milan.
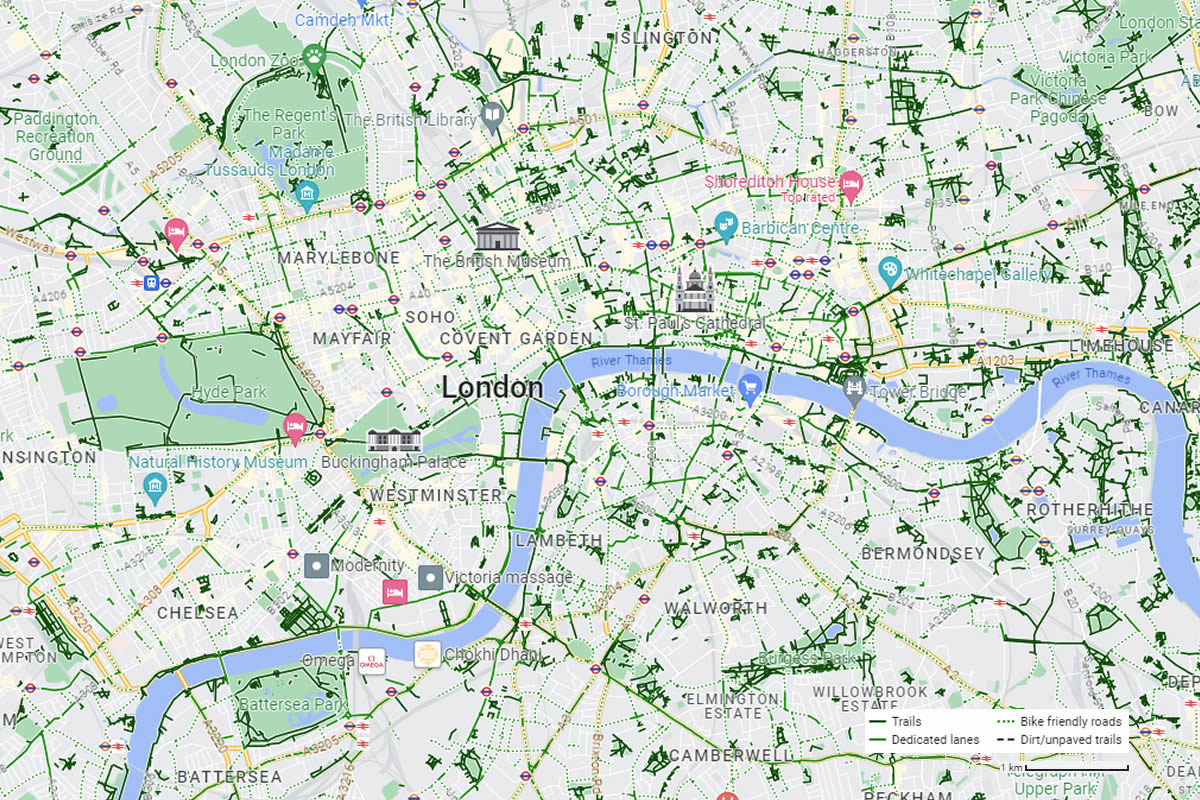
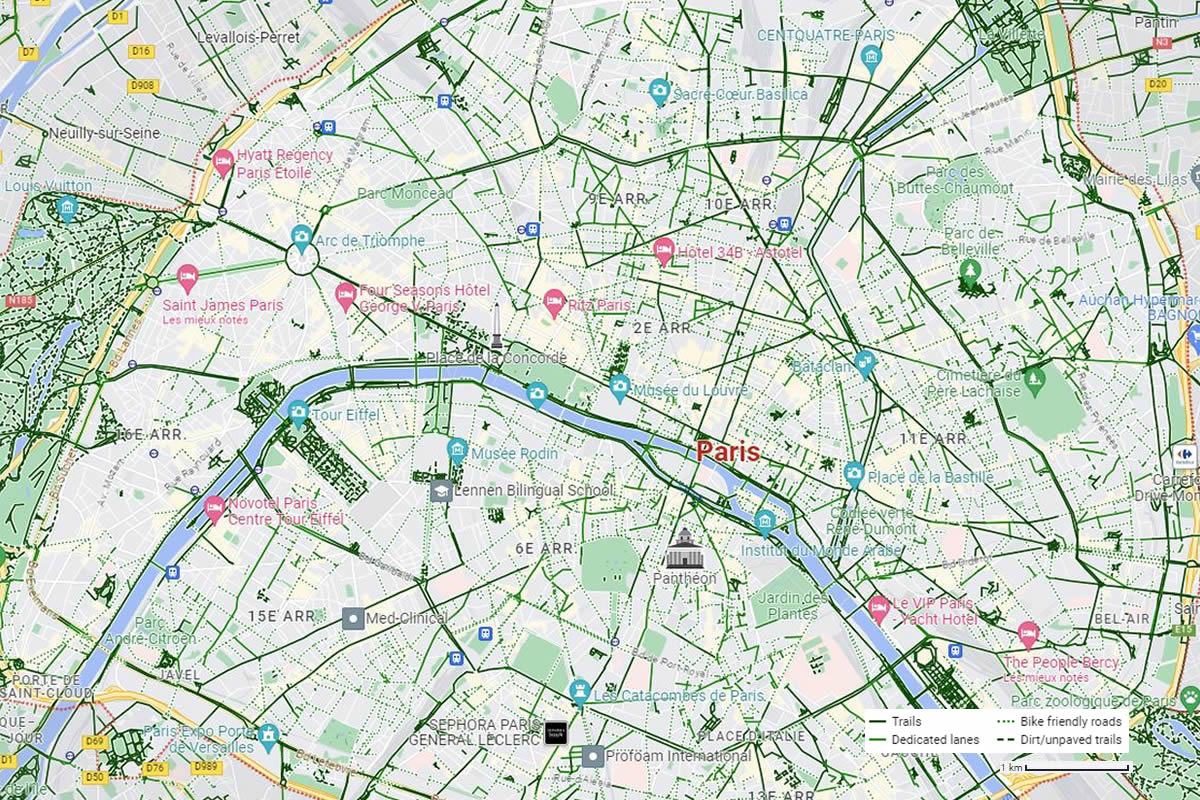
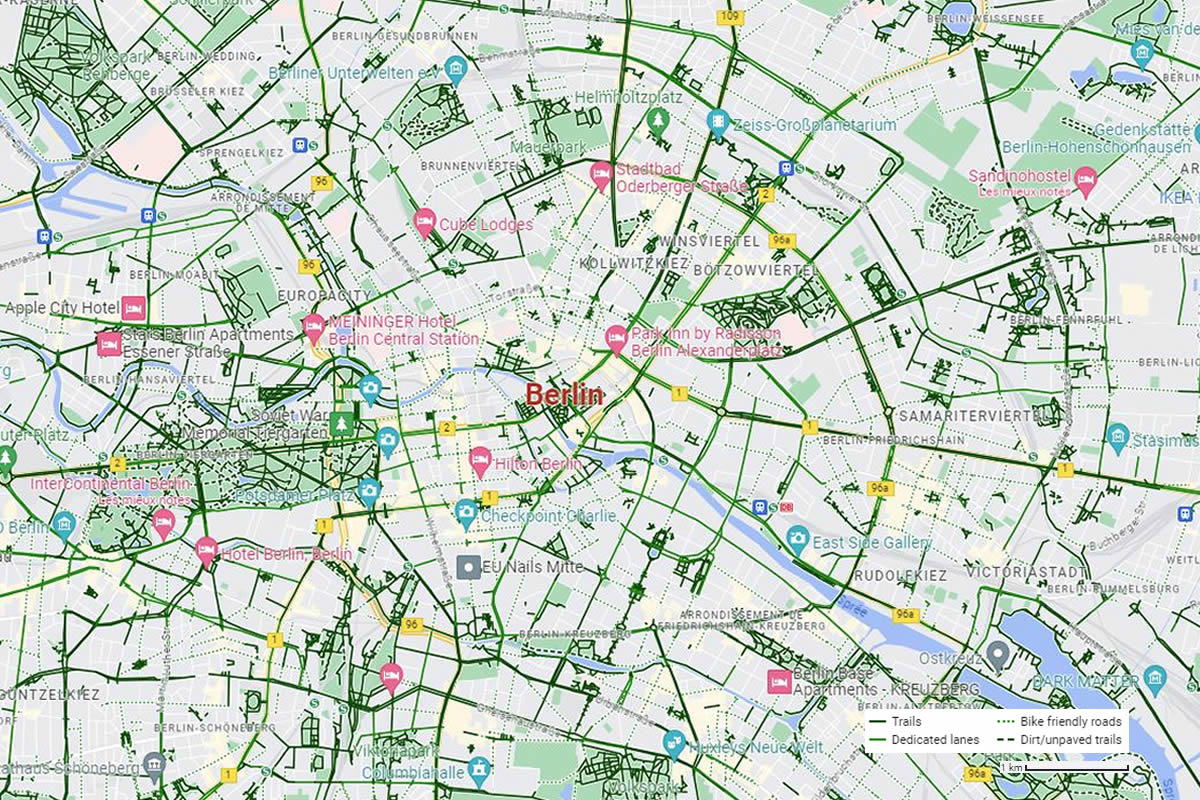
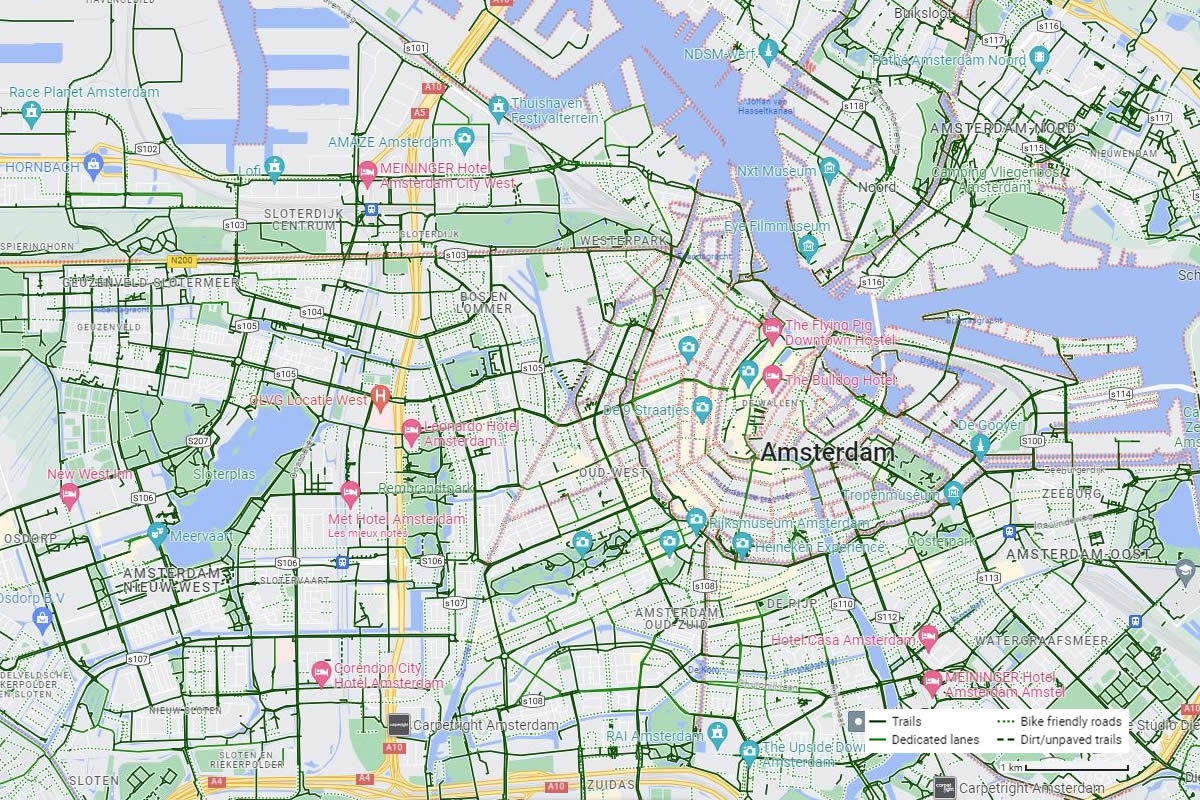
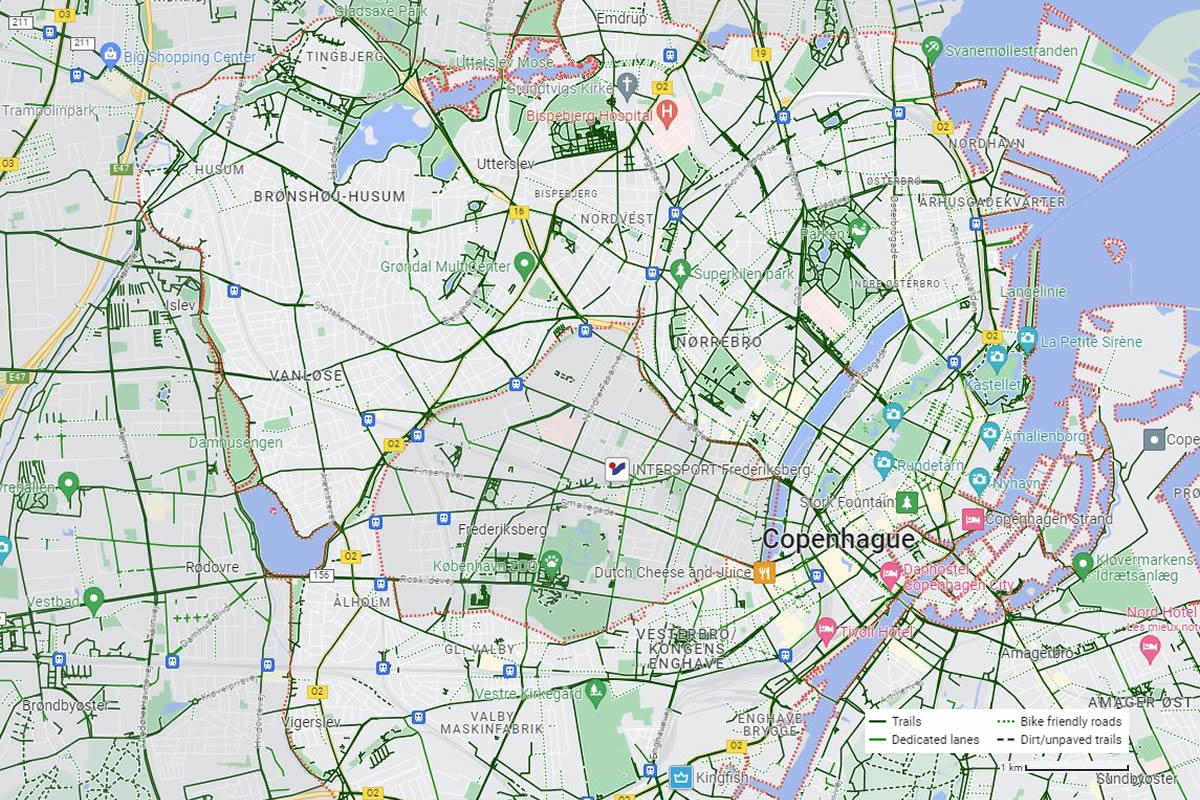
The comparison between the different images is striking. While the maps of Paris, Berlin, Amsterdam, and Copenhagen show a clear network of long designated and protected cycle lanes, forming a grid allowing full movements with bikes from east to west and north to south, London appears mainly as a patchwork of small dedicated cycleways, peppered with dots of green cycle lanes for short distances, with no coherence between them and leading to nowhere. The situation is even worse if you remove the numerous cycle paths shown in parks, which are a feature of London.
In some respects, London more closely resembles the city of Milan, where little effort has been made for cycling, and the city only shows small sections of routes dedicated to cycling.
When I stumbled upon a group of cyclists gathering at Travelodge in Falcon Road a few days ago, one of them told me about a small program he saw recently on Euronews comparing Paris and London, titled: Tale of two cities: Paris and London adopt different approach to future urban mobility.
The Euronews article said:
“Paris aims to become a 100% cycle-friendly city by implementing a car-free zone next year and has taken the decision to ban self-service electric scooters. In contrast, London has extended its e-scooter trial until at least May next year, with two million journeys made to date. […] While there are bold ambitions to expand protected cycle routes in London, an inability to make city wide changes means a lack of continuity on the roads.”
Efforts are paying as now Paris is ranking among the 10 most ranking of bicycle-friendly cities in the world according to the Copenhagenize Index (#8 in 2019).
Paris is investing €250 million (about £205 million) into its centralized plan to enhance cycling infrastructure within the next three years (about £70 million a year). In comparison, London is still showing a funding plan of £913 million over ten years starting in 2013, i.e., ~£90 million a year. In 2016, Sadiq Khan promised to increase that amount to £154m per year for cycling until 2022.
The problem here is that London is 15 times the size of Paris. Therefore, to compare with the effort made in the French capital, it should not be £90 million or £154 million per year but £1 billion every year. Even based on the number of inhabitants, it should be a minimum of about £350 every year, more than double the current funding.
Cycling infrastructures cost money, but a small amount in comparison to alternatives. In average:
- 1km of cycle routes (mix infrastructures including signage, on-road lanes, part segregated and marked cycle routes) = £460,000 to £880,000.
- 1km of segregated cycle lane = range from £1.15 million to £1.45 million for a two-way physically segregated. superhighway, to £740,000 per kilometre for a two-way lightly segregated superhighway according to DfT.
- 1km of tram = £25 million (source).
- 1km of Tube = £125 million (although the Elizabeth line cost £160 million per km).
Is it the government’s fault, the Mayor of London’s, or each individual borough’s responsibility?
In general, London has been seen as trailing other major cities and being reluctant to embrace alternative forms of transportation, possibly influenced by Margaret Thatcher’s belief in the future of individual cars. A decade after many other cities across the world, London finally allowed electric scooters in June 2021 on its roads, but only for individuals over 18 with a driving licence, and through private rental operators (Dott, Lime, Tier). Using a privately-owned e-scooter remains illegal, except on private land, and the government has repeatedly postponed a decision on the subject, extending the initial 12-month trial period that began in 2021 to 48 months, with no decision expected until at least 2024.
- Read our article: Is London paranoid about e-scooters?
Central government, and specifically the Department for Transport, is in charge of general rules (such as making legal or illegal e-scooters for instance) and can provide funding, but the cycling strategy depends entirely of the local authorities.
Euronews explained:
“Unlike Paris, London is placed into the hands of distinct boroughs. In Kensington and Chelsea there is currently no provision for cyclists. A few weeks ago a young woman sadly lost her life. In other parts of the city, cycling is catered for and campaigners say there needs to be more joined up thinking to prevent accidents from happening.”
The responsibility for managing London’s road network is shared between Transport for London (TfL), Highways England, and the 32 London boroughs, plus the City of London. While Highways England is responsible for monitoring the motorways (such as the M25),TfL manages London’s ‘red routes’ (the main roads) and is responsible for the maintenance, management, and operation of the capital’s 6,000+ sets of traffic lights. Each individual London borough is responsible for all the remaining roads within its boundaries.
TfL is controlled by the Mayor of London, who chairs the Board and is in charge of implementing the Mayor’s decisions. They have a dedicated budget for cycling (the ~£150 million that we discussed above) that they spend either to improve the cycling experience of their red routes or as grants to sponsor the projects of the different boroughs.
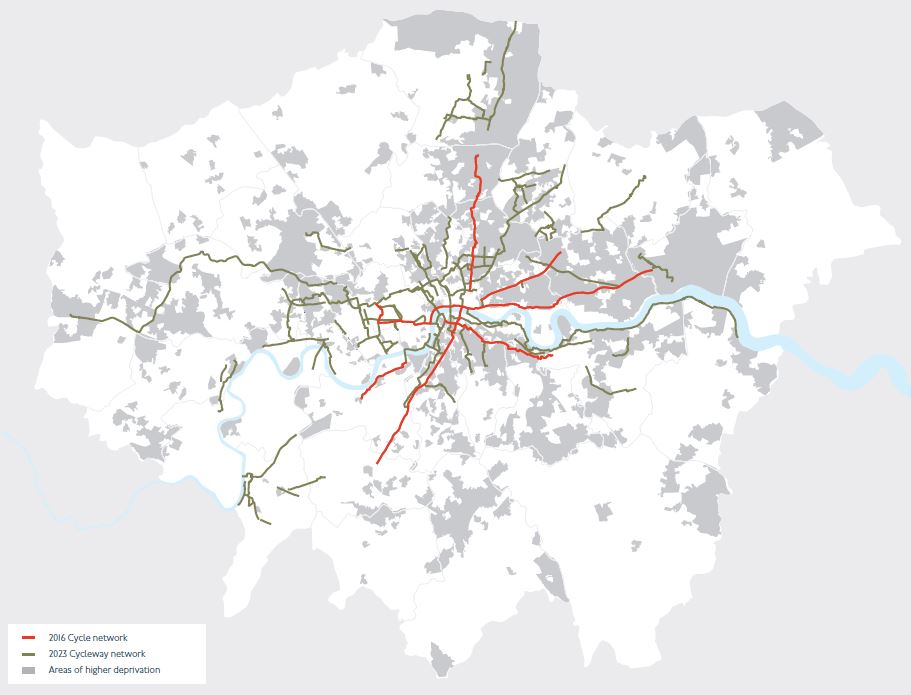
Unfortunately, as shown in the map below produced be the Mayor of London’s office, slow progress have been made in the last 7 years, and overall very little infrastructure south of the river with some exception in Lambeth and the poor CS8 along Battersea Park Road and York Road.
However, TfL appears to have conflicting priorities regarding the vehicular experience with concerns about traffic flow and a real money issue (see our article explaining why London is always seeking to charge more for vehicles).
Examples of infrastructures to provide a cycle-friendly experience
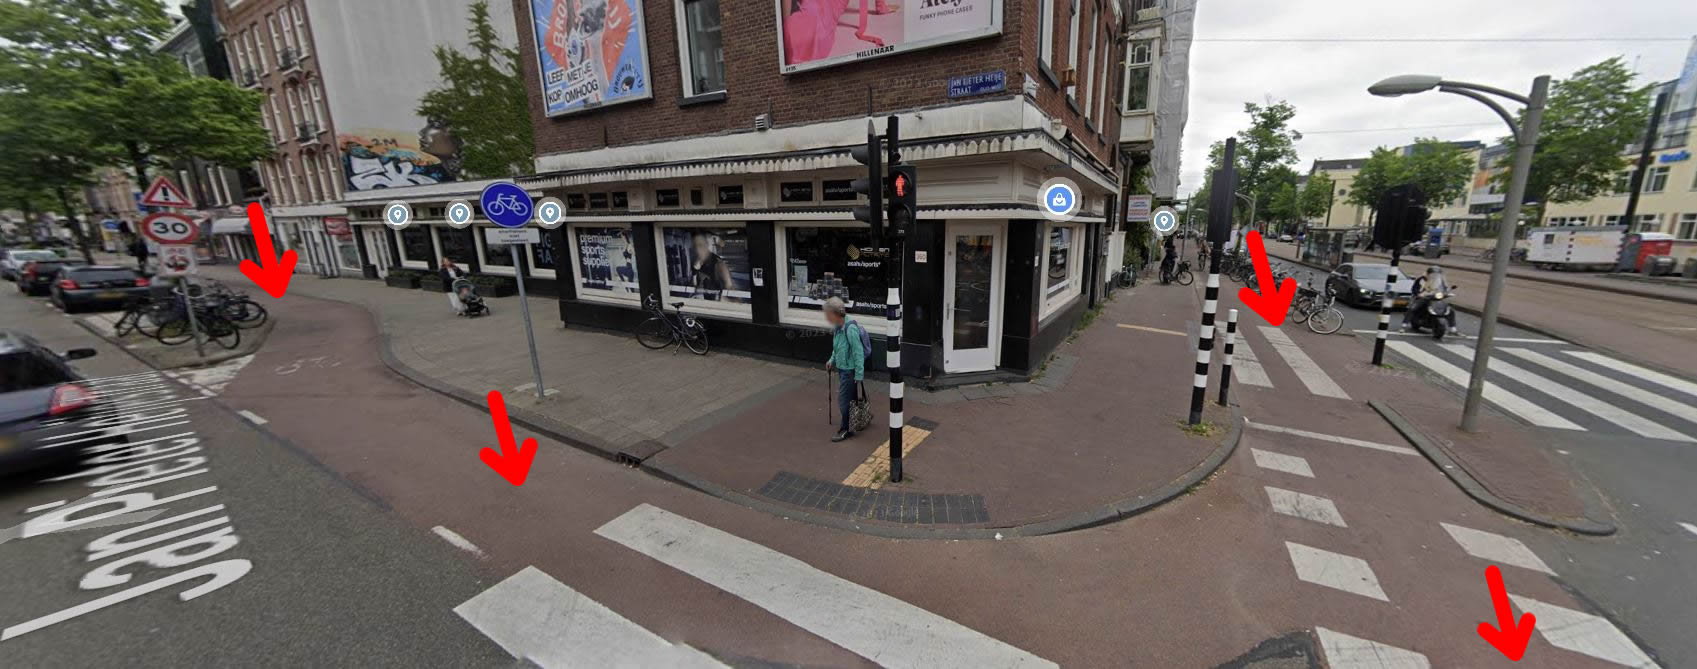
When looking at best practices for cycling infrastructure, the Dutch capital is one of the best examples. The French Youtuber Altis play, specializing in cycling, went to Amsterdam to explore the cycle infrastructure in the city. He said:
“The first thing I noticed about cycling facilities is the color of the bike lanes in Amsterdam. It may sound simple, but in Amsterdam, everything is red. There’s no doubt about it. Even the parts of the road designated for motor vehicles have a completely different color.
When there’s a shared zone, where pedestrians and cyclists share space with vehicles, it’s the vehicles that are invited onto the red area. In Amsterdam, they use a special red surface or bricks. This is a significant advantage because it avoids the need to repaint every two years.”
While Amsterdam initially had a diversity of signage for its cycle routes, it’s clear that the city is making efforts to unify all of them with smooth red asphalt.
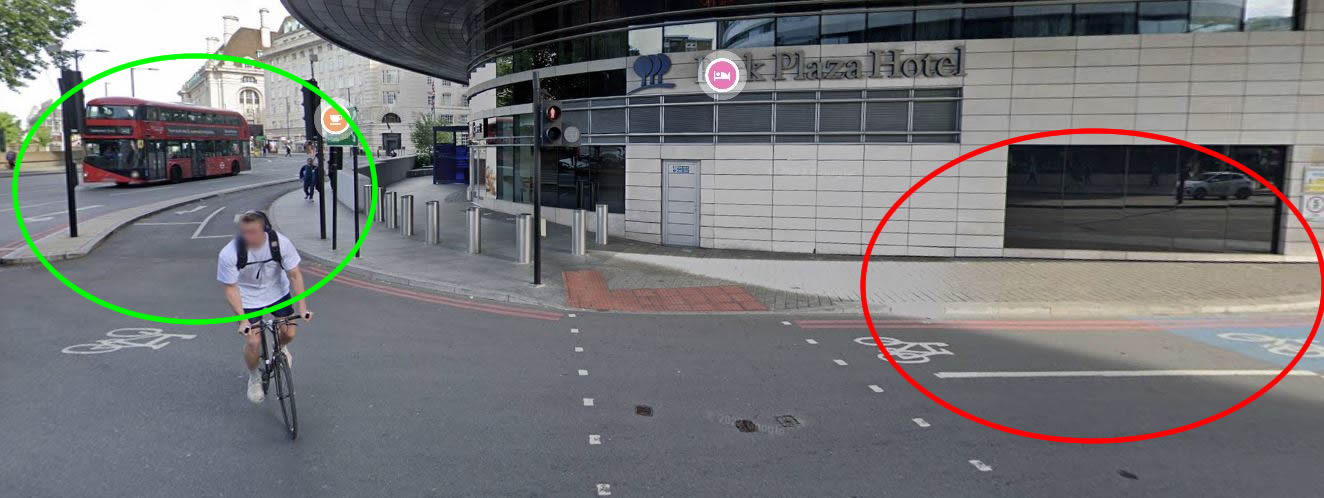
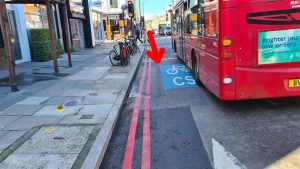
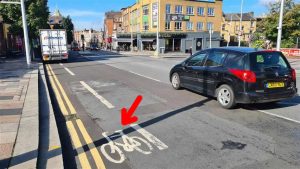
In London, we have the Cycle Superhighways, with blue-painted lanes (or faded blue due to poor maintenance), segregated lines with a pavement as along the Embankment, paths separated by wands from the main road, dotted white lines on the side of the road, big cycling marks in the middle of the road, or just indications of Q routes, or blue squares painted on the road, all without any consistency in terms of width.


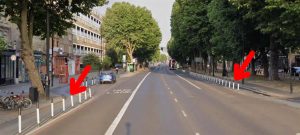
Another interesting point highlighted by Altis Play during their trip to Amsterdam is that most of the lanes are segregated (cycle bands exist but are progressively replaced by protected paths). He noted:
“In Amsterdam, physical barriers are widely used to separate bike lanes from motor vehicle lanes. These barriers can include concrete curbs, bollards, or raised medians. This creates a clear and safe separation between cyclists and motor vehicles, reducing the risk of accidents.”
And he concludes by saying:
“One of the most iconic features of Amsterdam’s cycling infrastructure is its extensive network of dedicated bike paths and lanes. In Amsterdam, there are dedicated bike paths and lanes throughout the city, making it easy and convenient for cyclists to get around. These paths and lanes are well-maintained and clearly marked, creating a safe and efficient cycling environment. […] there are valuable lessons that can be learned from Amsterdam’s approach to promoting cycling as a sustainable mode of transportation.”
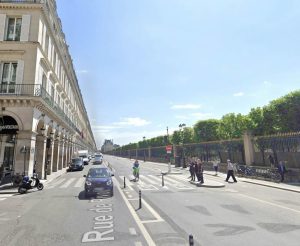
In addition to these two major cycling infrastructures, many other factors contribute to making a city cycle-friendly: bike lanes separated from bus lanes (Embarkment is a good example in London and Rue de Rivoli transformation in Paris), cyclist-friendly traffic lights, synchronized traffic lights specifically designed for cyclists, increasing the width of bike lanes, and more bicycle parking facilities, including secure locations with dedicated bike racks and bike garages.
Of course, it must be acknowledged that major changes are going to impact other road users and that it cannot be replicated everywhere. If anyone wants to gather arguments to advocate against such a ‘revolution’, they can simply refer to an article published in 2021 by The New York Times. It’s an anthology of all the reasons why measures to reduce cars and encourage alternative transport lead to a dystopian city according to some people, with the narrative using words such as “anarchy“, “mayhem“, “chaos“, “risky“, the lack of “cycling culture“, “hazardous interactions“, “afraid of being crushed“, “not safe” and Parisians are depicted as lawbreakers…
The latest cycling strategy was provided by Sadiq Khan in 2018 and has not been updated since then. At the start of the document, Will Norman, London’s Walking and Cycling Commissioner, said:
“Our 2018 Cycling Action Plan set out our vision for London to be the world’s best large city for cycling – this remains our ambition today.”
Five years later, this still appears more like an aspiration than a work in progress. While there are clearly some funding constraints aligned with the priorities of City Hall and TfL, the controversial ULEZ extension could also present an opportunity to redirect all the funds collected by the new tax towards funding cycling infrastructure for the British capital. This could provide a real boost to sustain the ambition announced by Sadiq Khan.
We will also consider the situation in Wandsworth and how the Council is planning to promote cycling within the borough in our next article.
Update 30/09/2023: Adding information about the Copenhagenize Index, Rue de Rivoli in Paris and the link to the New York Times article.
Update 1/10/2023: Adding cost of transport infrastructures.